Morning All,
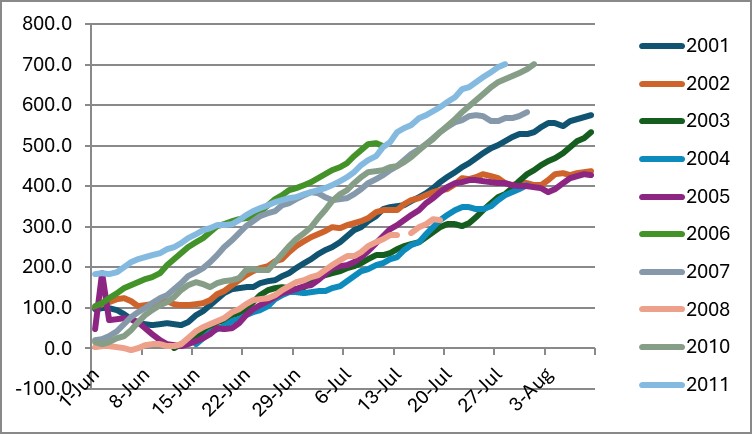
I thought I would attach some of the early data on RCU. What you can see from the graph below is the high degree of variability over the season. If I am looking at applying dormancy breakers this graph highlights why it is important to knowhow many hours you have had accumulated over the season to determine the correct time to apply product in the orchard. If I look at 500 RCU as being acritical minimum for some varieties, then I have an application date of the9/6/06 as against the 6/7/03 and all points in between. Apply before critical chill has been acquired then while you will get leaf out fruit set will still be compromised in the first instance. It is worth noting in these records the delay in chill accumulation in this area playing a major role in crop load. It also makes research more problematic as chill is so seasonal so it is more about reading the season than hoping to work to averages in chill as you can see from the graph below if I sprayed on the 6 July most of the time, I would not have acquired adequate chill in 8/10 years.
The graph below shows RCU for the Tandou orchard at Menindee. What this graph shows is the high degree of variability in chill (trends are the same but end points are highly different. The poor setting years can easily be linked to known chill requirements by variety and seasonal conditions for that season.
The current graph is in line with predictions from the Met Bureau for a mild autumn and warmer than average winter temperatures (though the met bureau forecasts have been wildly inaccurate in the past).
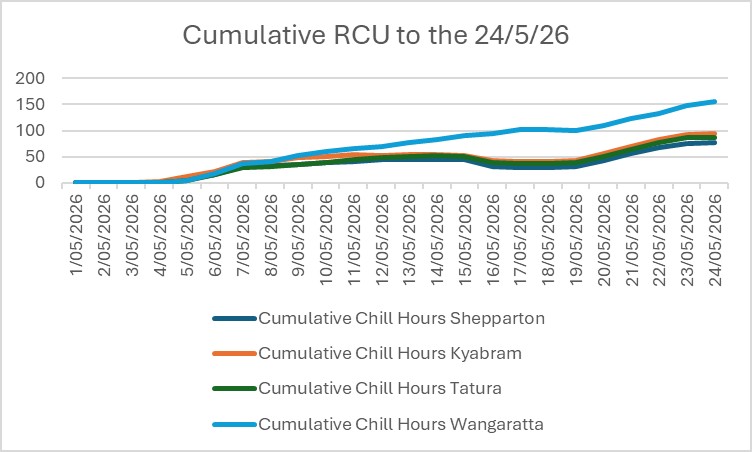
The graph of what is happening in the Goulburn Valley shows the main fruit growing areas are very similar and why Wangaratta attracted high chill lines to the region in the early 1980’s as an expansion district.
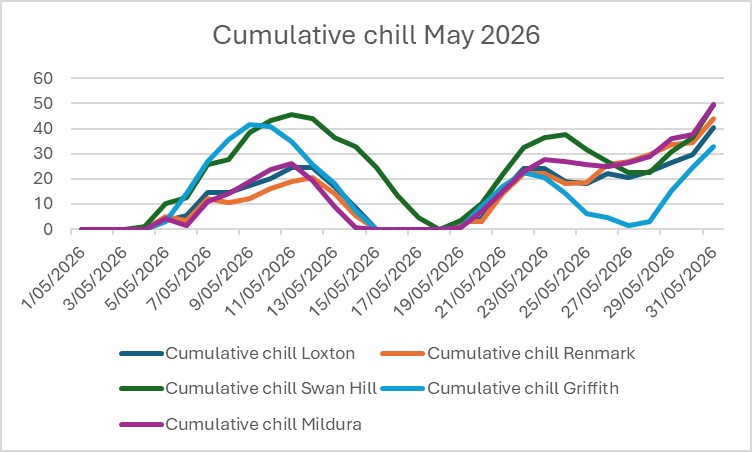
The table on comparative chill indicates across the board the slow start to chill accumulation in all regions.
Weather forecasts for the following weeks suggest that
- Riverland up to 70 RCU
- Mildura between 70-80 RCU
- Swan Hill > 80 RCU
- Griffith >80 RCU
- Goulburn Valley > 80 RCU
A very positive week.
Regards,
Shane Phillips | Head Chemist - Research & Development
E: shane.phillips@biocentral-labs.com
Stay connected and receive updates, resources and insights—subscribe to our newsletter today.